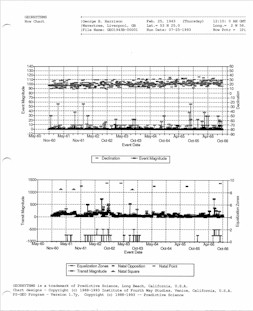
The Now Chart

Now Chart Sample
Now Chart Sample
The NOW Chart is a graphical representation of numeric data which depict events occurring at the time of, or generated as a result of close contact Transits against the backdrop of our inner strengths/weaknesses. When we consider the impact of Transits we first review the type of structure that is being activated (adaptive, resistive or combining), the relative strengths of the associated structures and the magnitude of the Fundamental and Transiting points involved.

The NOW Chart is mapped against a specific time period ranging from as short as short as one week up a length of two years per page. Multiple pages can be arranged in a sequence to gain both a general as well as a specific view of the subject's experience over significant periods of time. The NOW Chart graph depicts the numeric data in the following ways;

 
The NOW Chart is mapped against a specific time period ranging from as short as short as one week up a length of two years per page. Multiple pages can be arranged in a sequence to gain both a general as well as a specific view of the subject's experience over significant periods of time. The NOW Chart graph depicts the numeric data in the following ways;

The upper graph in the NOW Chart represents the inner perspective of the current experience. The graph which runs through the center (Declination) represents the general ease (downward slope) or difficulty (upward slope) of the life experience. The graph which runs along the bottom (Event Magnitude) with upward spikes represents the internal sensitivity/resistance of the individual to pressure from the external environment.

The lower graph in the NOW Chart represents the outer perspective of the current experience. The graph which runs through the center (Transit Magnitude) represents the impact of Transits on the individual with a nominal range from Zero to Two-Hundred-Fifty. Elevated Transits indicate periods of anxiety frequently accompanied by indecision and/or stress. Transit magnitudes above Five-Hundred are significant and ‘memorable’. Transit magnitudes above One-Thousand tend towards shock.

The graph which runs along the bottom (Equalization Zones) with upward spikes represents those points in the individual experience where resistance to external forces break down and the individual is forced to accept change. Zones of Equalization (ZOEs) tend towards dis-orientation (any value) and when combined with significant transits/aspects/event magnitudes indicate periods of stress and crisis, eventual change, re-direction or transformation.